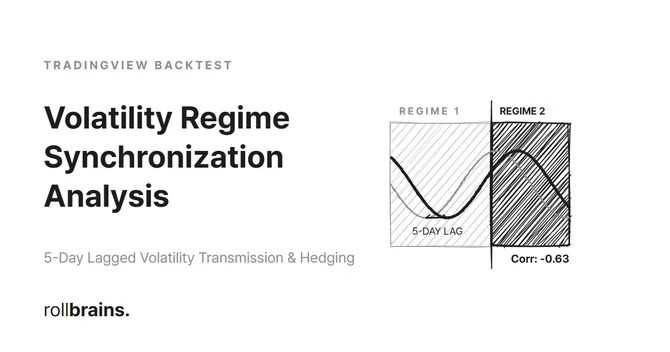
Nasdaq vs Corn Futures Volatility Regime Analysis

Is Buying Corn Futures Safe When Stocks Crash? Statistical Hedging Timing Analysis

⚠ Correction (2026-06-11): An earlier version of this post claimed a 5-business-day lagged negative volatility transmission from the Nasdaq-100 to Corn futures (r = −0.6355), supported by a GARCH(1,1) table and an N = 11,149 sample. A full re-verification could not reproduce any of it with real data: across 6,467 trading days (2000–2026) the volatility cross-correlation is flat at +0.07 to +0.09 at every lag, and the original table’s GARCH column traces to a pipeline error — a pure exponential decay, not a GARCH output. The text below reflects the corrected, measured figures. The full forensic walkthrough is in the self-audit post. ...
May 25, 2026 · 8 min · Steve
The Backtest Autopsy

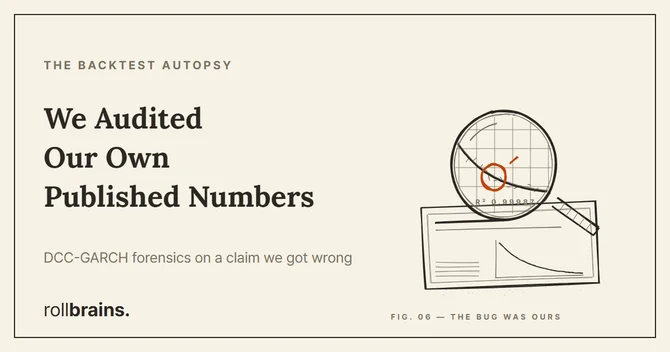
The Backtest Autopsy #6: Why the Corpse on the Table IS Our Own Post

💡 TL;DR — The Self-Audit Verdict (BLUF) The headline claim does not reproduce: across 6,467 trading days (2000–2026), the NDX–ZC volatility cross-correlation is flat at +0.07 to +0.09 at every lag from −10 to +10. The original post’s 5-day-lag negative correlation (printed as −0.6355) could not be reproduced with real data. The “GARCH” column was not GARCH: the original table’s conditional-volatility columns are pure exponential decay — log-linear R² = 0.99987 (NDX) and 0.99849 (ZC) — with zero shock response. A pipeline error, now documented and corrected. The window was a lottery: 12.3% of all 17-day windows in the full sample reach a correlation ≤ −0.6355 by chance alone. A 17-day correlation carries no evidential weight. Verdict: C1 refuted, C2 partially confirmed, C3 refuted. The original post is corrected; this audit is the public record. Seventeen days ago we published a hedging study claiming that Nasdaq-100 volatility shocks transmit to corn futures with a 5-business-day lag and a correlation of −0.6355. Seventeen is a fitting number, because seventeen rows of data is exactly what that claim stood on. A reader suggested we re-check the relationship with a proper DCC-GARCH model instead of a static correlation table — so we did, against 6,467 trading days of real NDX and ZC data spanning 2000–2026. ...

June 11, 2026 · 18 min · Steve
Why Your Entry Price IS the Edge

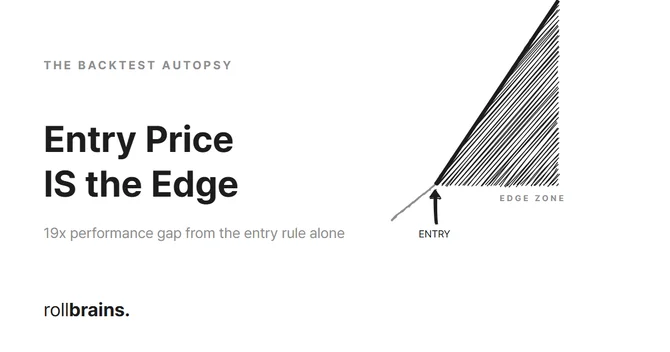
The Backtest Autopsy #1: Why Your Entry Price IS the Edge

💡 TL;DR / Summary - Entry Price Edge Empirical Key Takeaways (BLUF) Entry Location Governs Edge: Keeping all other parameters frozen, shifting the limit entry order from the projected pivot to the zone center caused the expected value to crash from +0.875R to +0.046R—a 19x collapse. Selection Bias Paradox: Deeper entries (zone center) do not buy cheaper; instead, they fail to fill on winning trades that reverse shallowly, selectively filling only failed, structure-breaking losing trades. Empirical Verification: We quantified this structural phenomenon across a massive dataset of 11,149 actual reversals, establishing entry price as the dominant driver of systematic edge. I changed one thing in a backtest. Not the strategy logic. Not the stop-loss, not the take-profit, not the position sizing, not the exit rules. Everything most traders call “the strategy” stayed frozen. ...

May 25, 2026 · 4 min · Steve
TradingView Remix Prompt Strategy

Master Prompt vs Split Questions on TradingView Remix

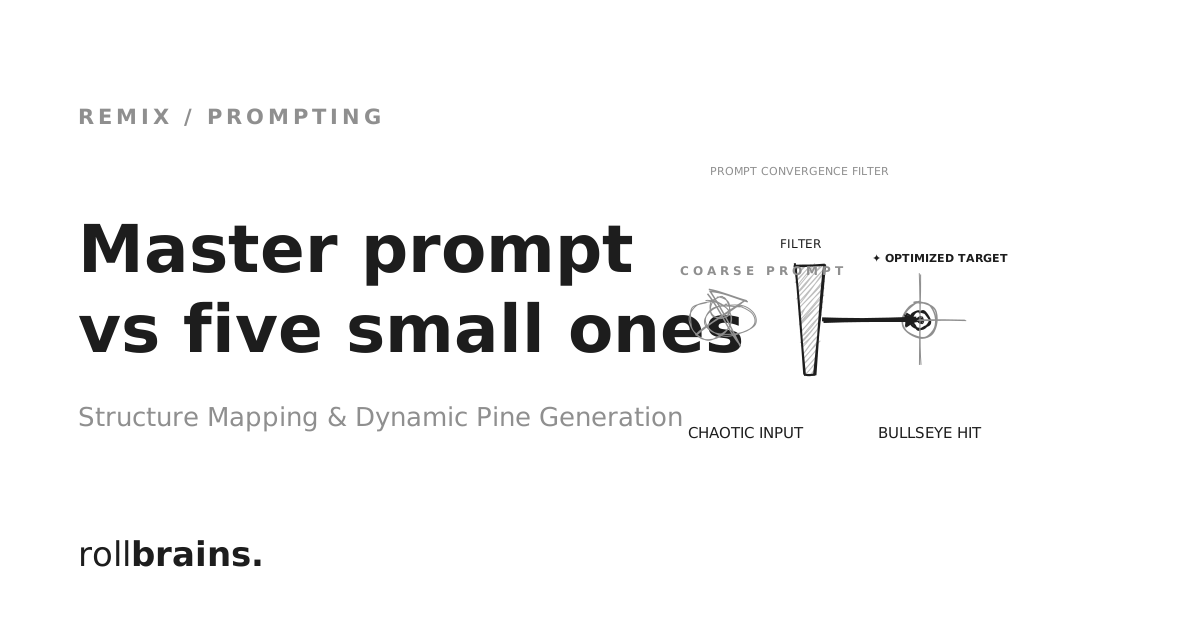
There’s a common claim that asking Remix one big “master prompt” saves significant usage versus splitting your questions. I tested both approaches with the same Bitcoin analysis on Premium (5×): four split questions consumed 10 tools (1% usage); a single master prompt with broader scope consumed 19 tools (also 1% usage). 💡 TL;DR / Summary - Master Prompt vs. Split Questions: Key Takeaways Myth Debunked: Asking a single master prompt does NOT save quota over split questions. Both burned exactly 1% of Premium weekly usage in our controlled tests. Session Context Subsidy: Chaining questions in the same session is surprisingly efficient. The last synthesis question cost only 2 tools thanks to automatic session context reuse. Strategic Choice: Use Master Prompts when you need a highly cohesive, self-contained report with automatic chart drawings in one shot. Use Split Questions for interactive, stepwise analysis. The 5× savings claim circulating online is exaggerated. But the master prompt does pack 9 more tools of work into the same 1% bucket — it doesn’t save quota, it produces more output per percent. Remix is officially promoted on the TradingView blog and distributed via the Chrome Web Store. ...

May 19, 2026 · 4 min · Steve