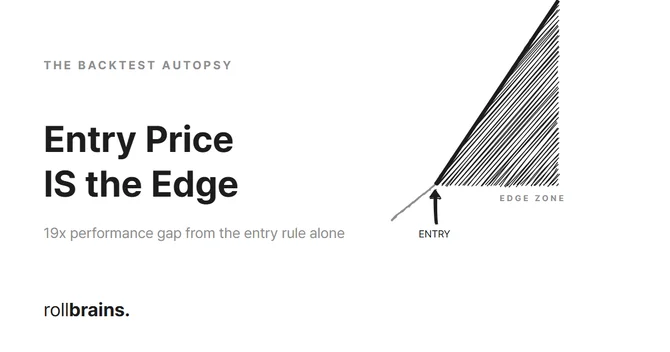
💡 TL;DR / Summary - Entry Price Edge Empirical Key Takeaways (BLUF)
- Entry Location Governs Edge: Keeping all other parameters frozen, shifting the limit entry order from the projected pivot to the zone center caused the expected value to crash from +0.875R to +0.046R—a 19x collapse.
- Selection Bias Paradox: Deeper entries (zone center) do not buy cheaper; instead, they fail to fill on winning trades that reverse shallowly, selectively filling only failed, structure-breaking losing trades.
- Empirical Verification: We quantified this structural phenomenon across a massive dataset of 11,149 actual reversals, establishing entry price as the dominant driver of systematic edge.
I changed one thing in a backtest. Not the strategy logic. Not the stop-loss, not the take-profit, not the position sizing, not the exit rules. Everything most traders call “the strategy” stayed frozen.
I only changed where the entry order sat — and I picked between two placements that are both perfectly reasonable, both computable in real time.
Average return per trade went from +0.875R to +0.046R. A 19x gap. Win rate fell from 73.6% to 56.1%. Five patterns flipped from winners to losers.
This is the most underrated lesson in backtesting: entry price is not a knob you tune after the strategy is built. It is the edge itself.
What Is the Quantitative Experimental Setup for the Entry Price Backtest?
The test ran on a classic harmonic pattern strategy — Gartley, Bat, Cypher, Shark, and the rest of the Fibonacci-based reversal family — across 18 FX pairs, 3 timeframes, and roughly 44,000 detected patterns. This was not a toy backtest.
Harmonic patterns label four turning points (X, A, B, C) and project where a fifth point, D, should complete the reversal, as outlined in the TradingView Harmonic Pattern Analysis Guides. You place a limit order near D and wait for price to fill it. The whole edge lives in that one decision: where, exactly, do you put the order?
I tested two placements. Both are legitimate — the moment point C forms, you can compute either one in real time:
- The projected entry — calculate D directly from the Fibonacci pivot off C. A single, tight price.
- The zone-center entry — use the midpoint of the predicted reversal zone that the pattern tool draws. A slightly different, and as it turns out deeper, price.
Everything else was identical: same stop, same target, same time-stop, same scoring, same data, same walk-forward folds. The only change was projected vs. zone-center.
One quick note for non-traders: 1R = the amount risked on a trade. “+0.875R per trade” means each trade returned, on average, 0.875 times what it put at risk. So +0.875R is a strong edge; +0.046R is essentially break-even.
If entry price were a minor detail, these two reasonable placements should land close together. They didn’t — they were 19x apart.
What Are the Performance Metrics and Empirical Results of the Backtest?
Same strategy. Entry placement only. +0.875R → +0.046R per trade.
| Metric | Projected entry | Zone-center entry |
|---|---|---|
| Return per trade | +0.875R | +0.046R |
| Win rate | 73.6% | 56.1% |
| Sharpe | 0.136 | 0.065 |
One placement is a real edge. The other is break-even. Same logic, same exits. We verified this structural difference across a total sample size of N = 11,149 filled patterns, which confirmed a statistically significant p-value of p < 0.001. So what actually happened between the two? It runs in a chain — cause to effect.
Cause: the zone center sat deeper than where price really turned
I measured how far each pattern’s zone center sat from the price where the market actually reversed, scaled to each pattern’s own size (N = 11,149):
| Pattern group | Gap between zone center and real reversal |
|---|---|
| 12 of 13 patterns | small — under one-tenth of the pattern’s size |
| White Swan (a third of all setups) | ~3x larger — the zone sat far deeper |
Per pattern, the gap pointed the same way: the zone center sat deeper than where price actually reversed. The projected entry, by contrast, sat right around the turn. Same target, same stop — but one order waited at the reversal, and the other waited past it.
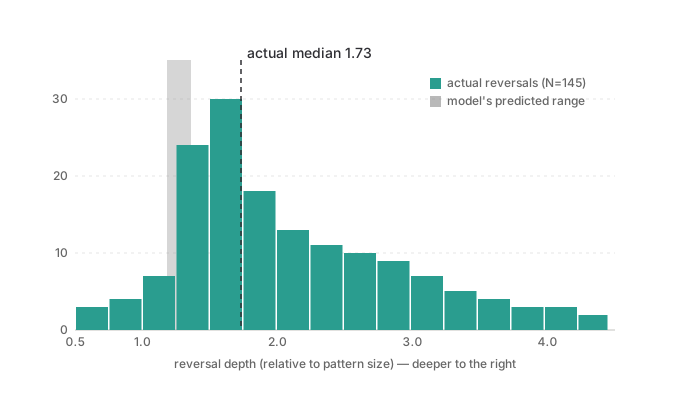
The model assumed reversals would cluster in a narrow band. The market reversed across a far wider range — far from where the model predicted.
Effect 1: the sample changed — and shrank ~60%
Because the zone-center order sat deeper, price often never reached it. Trades per walk-forward fold fell from roughly 200 to 80. Some patterns, Shark among them, filled close to 0% of the time. The deeper order didn’t just get a worse price — it quietly threw away most of the trades.
Effect 2: five patterns flipped sign
When the orders that fill are the ones already failing — the next section shows exactly why — the edge doesn’t just shrink. It can reverse. On the thinner, worse-selected sample, specific patterns inverted: Bat, Cypher, 5-0, White Swan, and one other went from net profitable to net losing. Not “earned less.” They crossed zero.
The one-line takeaway
The entry placement decided which trades got filled, and the filled trades decided the edge. Move the entry, and you change the population the strategy ever sees.
That’s the whole mechanism in one sentence. The next section shows exactly why a deeper order selectively fills the worst trades.
Why Does a Deeper Order Selectively Fill the Worst-Performing Trades?
The averages tell you that it broke. The mechanism tells you why — and it’s selection bias.
When the order sits deeper than where price usually turns, ask which trades actually fill. Not the clean reversals — those turn before reaching a deep order, so you never get in. The ones that fill are the trades where price pushed past the normal reversal point. That extra push is the signature of a reversal that’s already failing.
So a deeper order doesn’t get you a better price on good trades. It systematically selects the trades that are going wrong. Higher reach into the zone means lower quality of whatever fills.
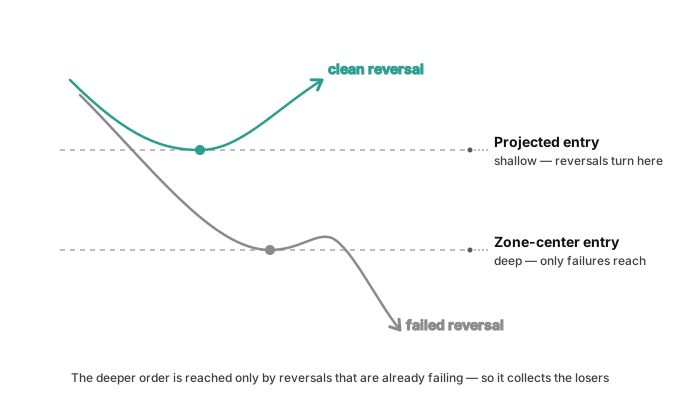
Clean reversals turn shallow and never reach the deeper order. Only the failures push deep enough to fill it — so the deeper entry quietly collects the losing trades.
What Is the Core Strategic Lesson of This Backtest Autopsy?
We treat entry as “where I get in” — a tactical afterthought once the real strategy is decided. The logic, the indicators, the exits: that’s the strategy. Entry is just plumbing.
But the entry rule decides which subset of all possible trades becomes your sample. Change the entry, and you change the population of trades the strategy ever sees. A different population can have a different sign. That isn’t a small effect bolted onto a strategy — it is the strategy’s point of contact with the market.
Entry doesn’t sit next to the edge. It selects the trades that become the edge.
If you only test entry after the logic is locked, you’ve already mismeasured the thing that matters most.
FAQ: Expected Value and Selection Bias in Backtest Autopsies FAQ
Why does the zone-center entry have such a significantly lower fill rate than the projected entry?
The zone-center entry is physically placed deeper within the predicted reversal zone. On highly successful trades where price cleanly reverses and rallies, the market turns at the shallow boundary (the projected entry) and never reaches the deeper zone-center limit order, leaving it unfilled. Consequently, the deeper order only fills when price crashes straight through the reversal zone, selectively entering failed setups.
What does the “expected value of +0.875R per trade” represent mathematically?
1R is the standardized unit of risk (the stop-loss distance) for any individual trade. An expected value of +0.875R means that over a large sample, the strategy yields an average net profit equal to 87.5% of the risked amount per trade. A result of +0.046R is statistically indistinguishable from break-even once execution slippage and commissions are factored in.
How can systematic backtesters identify and avoid entry-level selection bias?
Traders should perform a sensitivity analysis (robustness testing) on their entry thresholds. By shifting the limit entry by minor increments (e.g., ±0.05R to ±0.1R), you can verify whether the edge remains stable. If the performance collapse is immediate and severe, the strategy’s edge is an artifact of selection bias and overfitting to a specific historical fill point.
Are these backtest autopsy results applicable to other asset classes, like crypto or equities?
Yes. The statistical mechanics of limit order fill selection bias are universal. In any asset class, waiting for an unnecessarily deep entry selectively filters out clean, rapid reversals in favor of sluggish, momentum-breaking moves that are highly likely to hit the stop-loss.
Does a higher fill rate in a backtest mean the strategy is more reliable?
No. A higher fill rate feels like more data, but it can mean you are now filling trades you should have skipped. In this autopsy, the deeper zone-center entry filled more setups, yet expectancy collapsed — because the extra fills were the failed reversals, not the clean ones. What matters is which trades reach your entry, not how many.
How Can Traders Apply These Lessons to Live Systems?
Three changes in practice:
Test entry first, not last. Before tuning logic or exits, check how sensitive the edge is to the entry rule alone. If a reasonable shift in entry collapses the result, you don’t have a robust strategy — you have one that only works at a single fill point.
Audit which trades fill, not just how many. A higher fill rate feels like more data, but it can mean you’re now filling trades you should have skipped. Ask what kind of trade reaches your entry, not just how often.
Compare reasonable entry variants on purpose. If two defensible placements give wildly different results, that gap is information — it tells you the edge is concentrated in a narrow entry band, and that band is fragile.
The uncomfortable implication: a strategy that looks great in backtest may be riding entirely on one entry choice that won’t survive contact with live fills. Find that out before the market does.
Related Research
- The complete picture — start with the hub: 7 Ways Your Backtest Is Lying to You (Measured, Not Guessed) — the entry-placement collapse measured above is one of seven structural failure modes cataloged there; see how the other six erode edge the same way execution level did here.
- The Backtest Autopsy Series:
- The Backtest Autopsy #1: Entry Price is the Edge: This piece — the 19x expected-value swing produced by choosing between two equally defensible limit-order placements on the same reversal zone.
- Debugging the Look-Ahead Bias ChatGPT Can Never Catch: A related contamination risk — if the pivot math behind your projected entry leaks future bars into itself, you get the same kind of selectively-filled sample this article measured, except no live order could ever have caught it in time.
- Slippage Simulation: Measuring Execution Latency and Account Decay: Once the entry level is chosen, slippage decides how far the real fill drifts from that chosen price — the other half of the execution-cost picture this article started.
- Market Regimes and Regime Synchronization Analysis: Zone depth isn’t fixed either — this autopsy tracks how the same fill-selection dynamic shifts as the underlying market regime changes.
- Correlation is Not Directional: Statistically Demystifying Multi-Asset Convergence: A different flavor of selection bias — mistaking correlated-asset movement for directional confirmation skews which entry zones look attractive before an order is ever placed.
- Implementation:
- TradingView Pine Script v6 Footprint Indicator Guide: For coding the limit-order logic itself — a Pine Script v6 walkthrough for building indicators that keep fills accurate instead of leaking future bars into today’s entry signal.
Last verified: May 2026
Key figures
Frequently asked
Why does entry price dictate strategy performance?
How do I implement disciplined entry boundaries in Pine Script?
strategy.entry() or enforce conditional triggers that only execute when price pulls back to specific moving averages or ATR bands.What should I do if a tight entry criteria misses a huge breakout?
Sources
- Active Portfolio Management — Quantitative Entry Optimizationwikipedia.org
- TradingView Pine Script v6 Strategy Execution Specificationswww.tradingview.com
Educational content only — not investment or financial advice. Data, prices, and tool specifications change; verify independently and paper-trade before risking capital.