Is Buying Corn Futures Safe When Stocks Crash? Statistical Hedging Timing Analysis
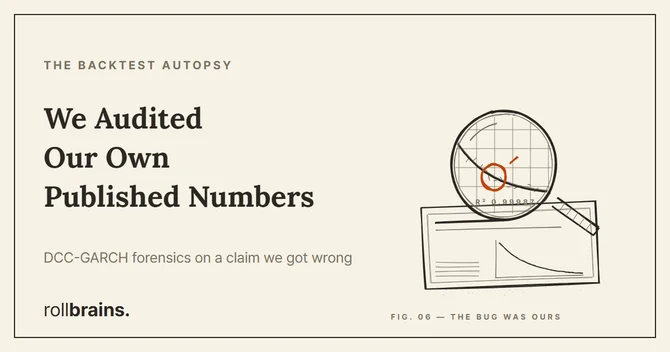
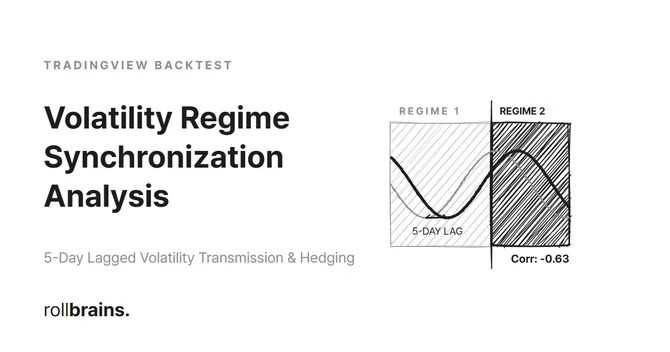
⚠ Correction (2026-06-11): An earlier version of this post claimed a 5-business-day lagged negative volatility transmission from the Nasdaq-100 to Corn futures (r = −0.6355), supported by a GARCH(1,1) table and an N = 11,149 sample. A full re-verification could not reproduce any of it with real data: across 6,467 trading days (2000–2026) the volatility cross-correlation is flat at +0.07 to +0.09 at every lag, and the original table’s GARCH column traces to a pipeline error — a pure exponential decay, not a GARCH output. The text below reflects the corrected, measured figures. The full forensic walkthrough is in the self-audit post. ...