💡 TL;DR
- A candle is a summary, not a path. Open, high, low, and close are four snapshots. The order in which the high and low were reached is thrown away.
- When the stop-loss and take-profit both land inside one candle, the candle only says “both were touched” — never which came first. The backtest engine fills that gap with a fixed assumption, and that assumption is a choice, not a measurement.
- Switch timeframes and the number of these ambiguous trades changes, so the result moves. Test on the timeframe you trade or finer, and check what fill assumption your engine makes.
A strategy that wins on the 1-hour chart and loses on the 15-minute chart
Consider a systematic trading strategy. Backtesting this strategy on a 1-hour chart yields a net profit. However, adjusting a single parameter — the candle timeframe — to 15 minutes while maintaining the identical rules results in a net loss. No other variables have been modified: the historical data, the analysis period, and the entry and exit conditions remain completely identical. The sole difference lies in the candle timeframe.
This discrepancy represents a fundamental challenge in systematic backtesting. While the standard advice to match the test timeframe to the execution timeframe is correct, the underlying mechanism is rarely explained. This shift in performance is neither a programming defect nor random noise. It is an inherent consequence of how OHLC candles compress price data and discard intra-bar price paths. Once this data-loss mechanism is understood, the choice of backtest timeframe becomes clear.
A candle is a summary, not a path
Each candle consists of four price points: open, high, low, and close. This comprises the entire historical record for that bar. A 1-hour candle aggregates all price fluctuations during that sixty-minute window, compressing them into these four discrete values.
It is critical to distinguish between the information that is preserved and the information that is discarded. The candle records the absolute highest and lowest prices reached during the hour, but it does not record when or in what sequence those extremes occurred. Whether the price surged to the high before falling to the low, or declined to the low before rallying to the high, is lost; the resulting OHLC values are identical. The actual intra-bar price path is permanently deleted.
For standard chart analysis, this data compression does not present a problem. Visualizing trends, support levels, and resistance zones relies on these four endpoints without requiring path information. However, this compression becomes highly problematic when a strategy’s exit rules depend on the precise order of price execution within a single bar.
When the stop-loss and take-profit both fall inside one candle
This is where the loss of intra-bar path data introduces execution ambiguity. Suppose a trader enters a long position, placing a stop-loss (SL) below the entry price and a take-profit (TP) above it. If a single candle forms with a high that reaches the take-profit and a low that reaches the stop-loss, both exit thresholds are triggered within that single bar.
In historical execution, one of two events must have occurred first: either the price declined to the stop-loss level, resulting in a loss, or it rose to the take-profit level, resulting in a profit. These represent opposite trade outcomes. However, the candle only records that both boundaries were touched. The sequence of execution is missing. The critical data point that determines the success or failure of the trade is precisely what the candle compression discarded.
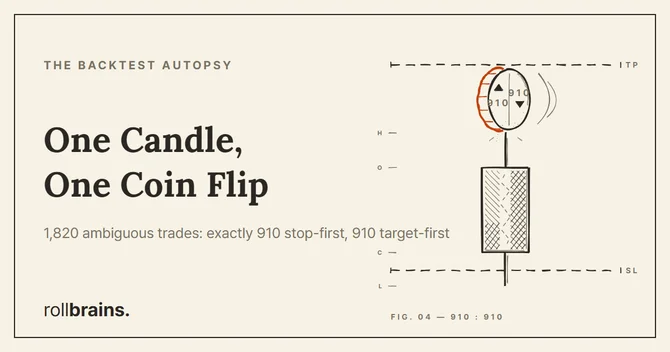
To evaluate whether this execution order exhibits systematic bias, we analyzed historical data. Using a tight, symmetric stop-target band on BTC — a scenario highly susceptible to trapping both thresholds within a single candle — we re-evaluated every ambiguous trade using 1-minute resolution data to determine the actual execution sequence. Out of 1,820 trades where both boundaries were touched inside a single coarse candle, 910 hit the stop-loss first and 910 hit the take-profit first. This is an exact 50:50 distribution. The coarse candle provides no objective evidence of execution sequence; it is statistically equivalent to a coin flip.
Empirical Adjudication of Execution Order (BTC 1-minute Resolution)
| Category | Measured Executions | Execution Rate (%) |
|---|---|---|
| Stop-Loss (SL) Hit First | 910 | 50.0% |
| Take-Profit (TP) Hit First | 910 | 50.0% |
| Total Ambiguous Trades | 1,820 | 100.0% |
So the engine fills the gap with an assumption
Because the candle cannot resolve the execution sequence, the backtest engine must apply a heuristic assumption to close the trade. Lacking empirical intra-bar path data, the engine relies on a pre-defined rule:
- Optimistic (take-profit first): The engine assumes the profit target was hit before the stop-loss. Many default chart-based engines employ this logic, which potentially overstates historical performance.
- Pessimistic (stop-loss first): The engine assumes the stop-loss was hit before the profit target. Some testing frameworks (e.g.,
backtesting.pyfor market entries) adopt this conservative stance to avoid overstating performance. - Open → high → low → close walk: The engine traverses the four price points in a fixed order. This is simply another static assumption about execution sequence.
Each of these methods represents an algorithmic choice rather than an empirical measurement. This connects directly to the selected timeframe: larger candles aggregate longer durations of price action, thereby increasing the probability that both exit thresholds fall within the same bar and trigger the engine’s assumption. A daily candle traps significantly more ambiguous trades than a 15-minute candle. Consequently, changing the timeframe alters the proportion of trades resolved by heuristic assumption rather than by real price action. This is the primary driver of performance discrepancies when switching timeframes. On a 1-hour chart, a subset of trades may be optimistically assumed to be profitable, whereas on a 15-minute chart, those same trades are resolved differently, resulting in a loss.
So which timeframe should you backtest on?
The part of “which timeframe” that this principle answers is about execution precision — making sure your backtest does not decide too many of your trades by assumption.
Test on the timeframe you trade, or finer. If you place and manage trades on the 15-minute chart, do not backtest on the daily candle. The daily candle hides far more intra-bar order, so it pushes more of your exits into the guessed-assumption zone. A candle at or below your trading timeframe keeps the proportion of ambiguous trades low, so more of your result comes from real price action and less from the engine’s rule.
Then check what fill assumption your engine uses. Find out whether it assumes take-profit first, stop-loss first, or an open-high-low-close walk. If it assumes the optimistic case, treat backtests with tight stops and targets on coarse candles as inflated — those are exactly the setups that trap both lines in one candle. If it assumes the pessimistic case, the same setups will look unfairly bad. Either way, knowing the assumption tells you which direction your numbers are bent.
What this principle does not decide is the broader “best timeframe for my style” question — whether a scalper should use 1-minute or a swing trader 4-hour. That depends on data history length, sample size, and your strategy’s own logic, which are separate axes. (See the related backtest articles below for those.)
💡 Tip: A finer candle shrinks the problem; it does not erase it. Even a 1-minute candle is still a candle, so the order of prices inside that minute remains unknown. However, moving from a daily candle to a 1-minute candle raises the resolution 1,440 times, so the proportion of ambiguous trades drops sharply. You are reducing the reliance on assumptions, not eliminating it.
FAQ
Q1. Why does the same strategy give different backtest results on different timeframes?
A candle records only four prices: open, high, low, and close. It does not record the order in which the high and low were reached. On a larger timeframe, each candle packs more time into those four numbers, so more trades end up with both the stop-loss and the take-profit falling inside one candle. When that happens, the engine cannot know which was hit first, so it guesses with a fixed assumption. Switch the timeframe and the number of these guessed trades changes, which is why the result moves.
Q2. If the stop-loss and take-profit are both inside one candle, which one does the backtest count?
It depends on the engine’s assumption, not on what actually happened. Some engines assume the worst case (stop-loss first), some assume the best case (take-profit first), and some walk open to high to low to close. None of these is a measurement. We checked the tightest case on BTC and the real order was a coin flip: out of 1,820 trades where both were touched in one candle, 910 hit the stop first and 910 hit the target first. The candle simply does not contain the answer.
Q3. Which timeframe should I backtest on?
For the execution-precision part of the question, test on the same timeframe you trade, or finer. If you trade on the 15-minute chart, do not backtest on the daily candle, because the daily candle hides far more intra-bar order than the 15-minute one. The finer the candle, the fewer trades fall into the ambiguous case. Then check what fill assumption your engine uses, so you know whether it is overstating or understating your performance on the ambiguous trades.
Q4. Does using a finer timeframe completely fix the problem?
No, it shrinks it. Even a 1-minute candle is still a candle, so the order of prices inside that one minute remains unknown. However, moving from a daily candle to a 1-minute candle raises the resolution by 1,440 times, so the proportion of ambiguous trades drops sharply. You reduce the reliance on assumptions; you do not eliminate it. Understanding this limitation is key, as it alerts you to treat tight stop-target setups on coarse candles with caution.
Related Research
- The complete picture — start with the hub: 7 Ways Your Backtest Is Lying to You (Measured, Not Guessed) — the 50:50 stop-loss/take-profit coin flip measured above is just one of seven structural failure modes cataloged there; see where it ranks against the other six before you trust a single equity curve.
- The Backtest Autopsy Series:
- Debugging the Look-Ahead Bias ChatGPT Can Never Catch: A different flavor of the same problem. Here the engine guesses which price hit first inside one candle; there, it accidentally sees tomorrow’s candle before today’s decision is made — both invisible once the equity curve is drawn.
- Slippage Simulation: Measuring Execution Latency and Account Decay: Once you know whether the stop-loss or take-profit actually fired first, this measures the next gap in the chain — the delay and cost between that fill and what your account really received.
- Correlation is Not Directional: A reminder that not every hidden assumption lives inside a single candle — a converging correlation can mislead your directional read before price ever reaches your stop or target.
Key figures
Frequently asked
Why does the same strategy give different backtest results on different timeframes?
If the stop-loss and take-profit are both inside one candle, which one does the backtest count?
Which timeframe should I backtest on?
Does using a finer timeframe completely fix the problem?
Sources
- TradingView Pine Script v6 Official Reference Manualwww.tradingview.com
- OHLC bar definitionen.wikipedia.org
Educational content only — not investment or financial advice. Data, prices, and tool specifications change; verify independently and paper-trade before risking capital.