The Anatomy of Look-Ahead Bias: Auditing Volatility and Stop-Loss Causality

The Anatomy of Look-Ahead Bias: How Algorithmic Backtests Lie (And How to Audit Them)

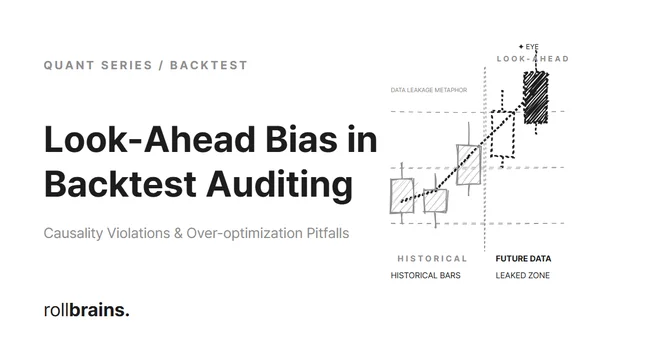
💡 요약 / TL;DR - Look-Ahead Bias & Stop-Loss Causality Executive Summary (BLUF) Insidious Causality Leaks: Look-ahead bias and structural causality violations inflate backtest metrics, presenting a statistical illusion of high performance that translates into immediate capital loss in live execution. AI Semantic Blindspot: LLM coding assistants only validate syntactic compilation rather than semantic causality, generating flawless-compiling trading code that silently snoops into the future. Algorithmic Defenses: Enforcing constant level stop locks, prioritizing pre-finalized historical indicators (t-1), and implementing automated Pandas forward-mask unit tests are vital to ensure statistical survival. Three Systemic Defects in AI-Generated Backtests When developers ask AI coding assistants (such as ChatGPT, Claude, or Copilot) to generate trading bot backtests, the resulting code almost always compiles without syntactic runtime errors. However, beneath the clean syntax, these models routinely embed three fatal causality leaks that guarantee bankruptcy in real-world markets. ...
May 31, 2026 · 5 min · Steve
Order Book Microstructure and Dynamic Slippage Simulation Guide

Order Book Microstructure and Slippage Simulation: How Fixed Assumptions Hide Execution Ruin

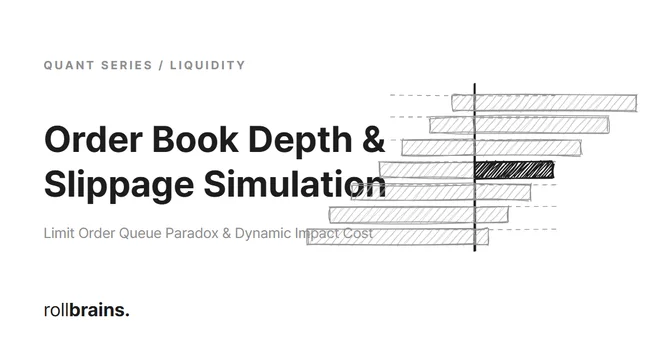
💡 TL;DR - Order Book & Slippage Simulation Executive Summary (BLUF) Empirical Reality of Slippage: Standard backtesting engines that assume instant, guaranteed limit fills or rely on static, flat slippage parameters heavily distort the empirical reality of execution friction. In live cryptocurrency markets, ignoring non-linear Market Impact Costs can easily erode over $20$% of net algorithmic profits. Virtual Queue & Power-Law: Quantitative developers must incorporate dynamic power-law slippage modeling conditioned on localized pool depth and implement fill-probability filters ($P(\text{fill})$) that simulate queue position and time-to-fill priority under various volatility regimes. Execution Integrity: Incorporate defensive prompt constraints (Adaptive Sizing) to dynamically scale down entry sizes or perform split executions when trade volumes exceed 10% of the active order book depth. The Limit Order Mirage: The Flaw of 100% Fill Certainty When quantitative developers instruct AI coding engines (such as ChatGPT, Claude, or Copilot) to generate backtesting scripts using limit orders, the systems typically produce basic execution logic that looks like this: ...

June 1, 2026 · 5 min · Steve
A candle shows both stop-loss and take-profit were touched, but not the order

Why Your Backtest Changes When You Switch Timeframes (And Which Candle to Actually Use)

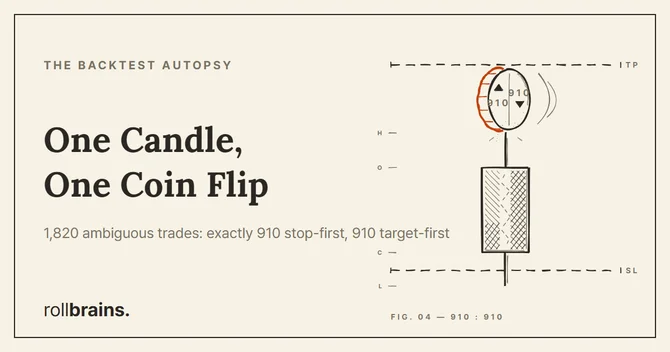
💡 TL;DR A candle is a summary, not a path. Open, high, low, and close are four snapshots. The order in which the high and low were reached is thrown away. When the stop-loss and take-profit both land inside one candle, the candle only says “both were touched” — never which came first. The backtest engine fills that gap with a fixed assumption, and that assumption is a choice, not a measurement. Switch timeframes and the number of these ambiguous trades changes, so the result moves. Test on the timeframe you trade or finer, and check what fill assumption your engine makes. A strategy that wins on the 1-hour chart and loses on the 15-minute chart Consider a systematic trading strategy. Backtesting this strategy on a 1-hour chart yields a net profit. However, adjusting a single parameter — the candle timeframe — to 15 minutes while maintaining the identical rules results in a net loss. No other variables have been modified: the historical data, the analysis period, and the entry and exit conditions remain completely identical. The sole difference lies in the candle timeframe. ...

June 3, 2026 · 10 min · Steve
The Backtest Autopsy

The Backtest Autopsy #6: Why the Corpse on the Table IS Our Own Post

💡 TL;DR — The Self-Audit Verdict (BLUF) The headline claim does not reproduce: across 6,467 trading days (2000–2026), the NDX–ZC volatility cross-correlation is flat at +0.07 to +0.09 at every lag from −10 to +10. The original post’s 5-day-lag negative correlation (printed as −0.6355) could not be reproduced with real data. The “GARCH” column was not GARCH: the original table’s conditional-volatility columns are pure exponential decay — log-linear R² = 0.99987 (NDX) and 0.99849 (ZC) — with zero shock response. A pipeline error, now documented and corrected. The window was a lottery: 12.3% of all 17-day windows in the full sample reach a correlation ≤ −0.6355 by chance alone. A 17-day correlation carries no evidential weight. Verdict: C1 refuted, C2 partially confirmed, C3 refuted. The original post is corrected; this audit is the public record. Seventeen days ago we published a hedging study claiming that Nasdaq-100 volatility shocks transmit to corn futures with a 5-business-day lag and a correlation of −0.6355. Seventeen is a fitting number, because seventeen rows of data is exactly what that claim stood on. A reader suggested we re-check the relationship with a proper DCC-GARCH model instead of a static correlation table — so we did, against 6,467 trading days of real NDX and ZC data spanning 2000–2026. ...

June 11, 2026 · 18 min · Steve
The Deflated Sharpe Ratio explained — correcting a backtest Sharpe for trials and non-Normality

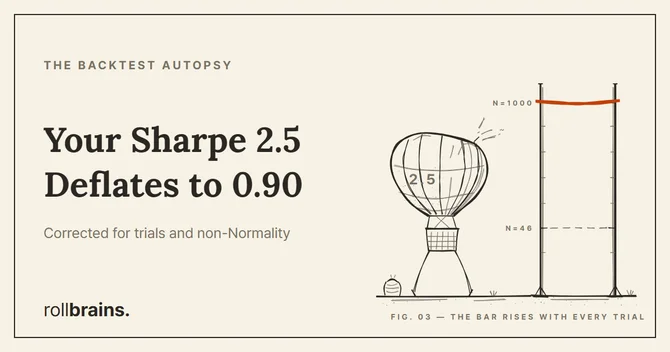
The Deflated Sharpe Ratio: Why a 2.5 Sharpe Can Still Be Statistical Noise

💡 Key Takeaways A high Sharpe is not evidence on its own. The Deflated Sharpe Ratio (DSR) corrects a backtest Sharpe for two inflation sources at once: selection bias from trying many strategies, and non-Normal (skewed, fat-tailed) returns. The bar moves with the number of trials. Even if the true Sharpe is zero, the expected maximum Sharpe across N independent trials is positive. DSR sets the rejection threshold to that expected maximum — so the more you search, the higher you must clear. The worked number is sobering. A Sharpe of 2.5 (5 years daily, skew −3, kurtosis 10) found after N=1000 trials has a DSR of only ≈ 0.90 — it fails the 95% bar. The identical result found after just N=46 trials would have passed at 0.9505. This explainer reconstructs the Deflated Sharpe Ratio strictly from the primary source — Bailey & López de Prado, “The Deflated Sharpe Ratio: Correcting for Selection Bias, Backtest Overfitting and Non-Normality” (Journal of Portfolio Management, 2014). It pairs with our empirical Backtest Autopsy series, which measures the failures this metric is designed to catch. ...

June 9, 2026 · 8 min · Steve
7 Ways Your Backtest Is Lying to You — Measured, Not Guessed

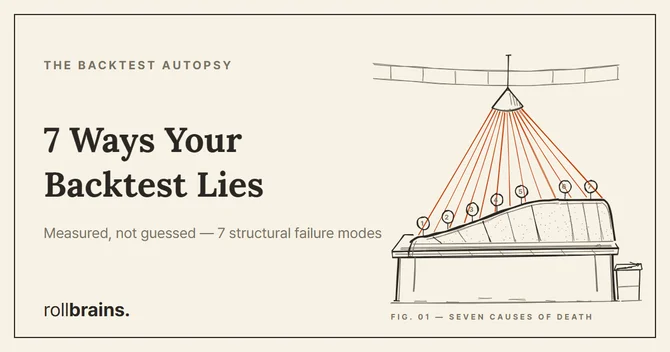
7 Ways Your Backtest Is Lying to You (Measured, Not Guessed)

💡 TL;DR — 7 Structural Failure Modes, Each Measured (BLUF) Look-Ahead Bias: A tight ATR trailing stop can produce a 93.3% win rate in backtest. That win rate is a mathematical artifact of the stop being set after the move it was supposed to protect against. Intrabar Ambiguity: When both stop-loss and take-profit fall inside one candle, the candle contains no information about which fired first. rollbrains measured this on 1,820 BTC trades: the real answer was a coin flip. Slippage: In a rollbrains altcoin grid test, ignoring dynamic slippage drove win rate from 48.2% to 31.5% — and flipped net expectancy negative. Entry Price: Two reasonable entry placements, same logic, same exits. One returned +0.875R per trade. The other returned +0.046R. A 19x gap from one decision. Survivorship Bias: Crypto funding rates are charged on notional, not margin. A 3-day hold with a 0.5% stop loses ~18% of 1R to funding alone — before any trade result. Regime Change: A strategy optimized for one volatility regime doesn’t travel. The Nasdaq-Corn study’s “5-day lag, r = −0.6355” claim could not be reproduced in a 6,467-trading-day DCC-GARCH re-validation and has been corrected — it came from a 17-day sample, and the correction itself is now this series’ measured example. Correlation ≠ Direction: An FX reversion model reverted 98.01% of the time. The individual trade win rate was 47.47%. These two numbers measure different things. Most guides on backtesting mistakes are lists of things to worry about. This one is different: every failure mode described here was measured in a rollbrains experiment, with real data, and the result disagreed with what a naive backtest would have shown. ...

June 8, 2026 · 14 min · Steve
The 5 Graveyards of Crypto Backtesting

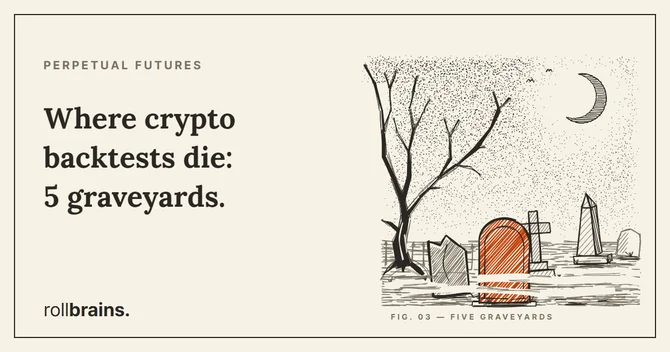
The 5 Graveyards of Crypto Backtesting

💡 Bottom Line A crypto perpetual-futures backtest fails live for five reasons, but only two are crypto-specific: notional-based funding drag and silent data gaps. Fix those here. The other three (limit-fill illusion, slippage and latency, look-ahead bias via joins) are universal backtest sins that apply to stocks, FX, and futures alike. We measured each one with real data in the Backtest Autopsy series, so this guide links out instead of repeating them. The funding numbers below are worked calculations from stated assumptions, not a measured study. The measured forensics live in the linked spokes. This is a methodology guide, not a forensic report. Where a claim needs measured proof, we point to the specific Backtest Autopsy spoke that measured it, rather than reproducing numbers here. ...

June 4, 2026 · 10 min · Steve
Correlation Is Not a Direction Signal

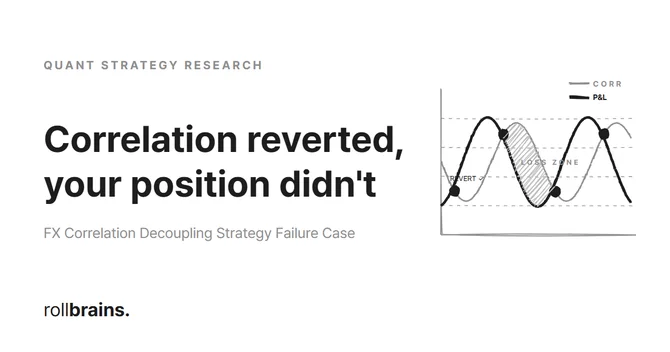
Correlation Is Not a Direction Signal: Inside a 98% Reversion, 47.47% Win-Rate Real-World Failure

💡 Key Takeaways The Reversion Fallacy: The rolling correlation Z-score successfully converged to its baseline with a stellar 98.01% probability, but the directional trades placed on the decoupled legs yielded a dismal 47.47% win rate. Lack of Directional Alpha: Correlation reversion can occur via multiple distinct price paths (Dynamic Drift). A relative spread convergence does not guarantee a specific direction for either individual asset. Trading a relational indicator as a single-instrument direction signal is statistically identical to a coin flip. Safe-Haven Turbulence: JPY cross-pairs structurally violate the mean-reversion assumption during global risk-off regimes, trending aggressively in one direction. Adding broker fee friction completely devours any remaining micro-alpha. This report is part of the COREX negative-result archive, published transparently in our Quant Strategy Research Hub. All figures presented in this article are verified empirical results obtained under the PRISM-R Framework v4.6.0 using a high-fidelity 10-year FX historical dataset, independent of any commercial software or affiliate marketing schemes. ...

May 31, 2026 · 12 min · Steve
Why Your Entry Price IS the Edge

The Backtest Autopsy #1: Why Your Entry Price IS the Edge

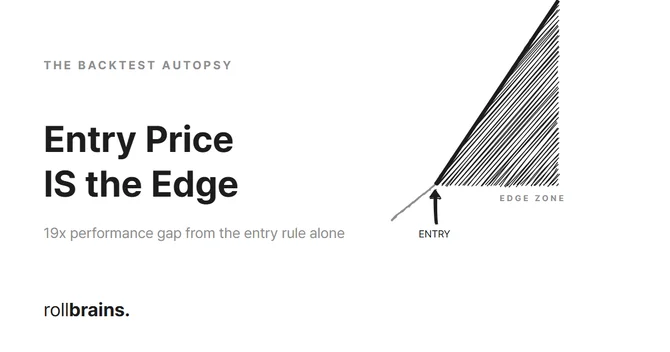
💡 TL;DR / Summary - Entry Price Edge Empirical Key Takeaways (BLUF) Entry Location Governs Edge: Keeping all other parameters frozen, shifting the limit entry order from the projected pivot to the zone center caused the expected value to crash from +0.875R to +0.046R—a 19x collapse. Selection Bias Paradox: Deeper entries (zone center) do not buy cheaper; instead, they fail to fill on winning trades that reverse shallowly, selectively filling only failed, structure-breaking losing trades. Empirical Verification: We quantified this structural phenomenon across a massive dataset of 11,149 actual reversals, establishing entry price as the dominant driver of systematic edge. I changed one thing in a backtest. Not the strategy logic. Not the stop-loss, not the take-profit, not the position sizing, not the exit rules. Everything most traders call “the strategy” stayed frozen. ...

May 25, 2026 · 4 min · Steve