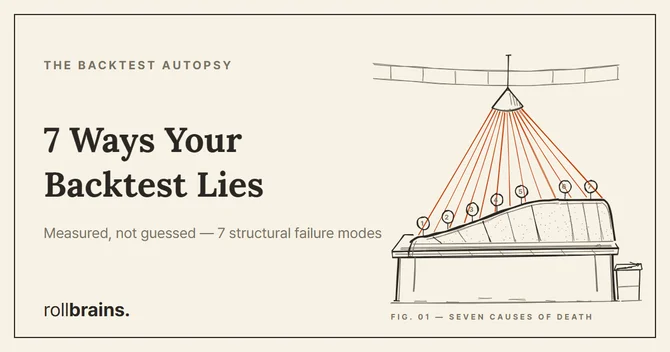
💡 TL;DR — 7 Structural Failure Modes, Each Measured (BLUF)
- Look-Ahead Bias: A tight ATR trailing stop can produce a 93.3% win rate in backtest. That win rate is a mathematical artifact of the stop being set after the move it was supposed to protect against.
- Intrabar Ambiguity: When both stop-loss and take-profit fall inside one candle, the candle contains no information about which fired first. rollbrains measured this on 1,820 BTC trades: the real answer was a coin flip.
- Slippage: In a rollbrains altcoin grid test, ignoring dynamic slippage drove win rate from 48.2% to 31.5% — and flipped net expectancy negative.
- Entry Price: Two reasonable entry placements, same logic, same exits. One returned +0.875R per trade. The other returned +0.046R. A 19x gap from one decision.
- Survivorship Bias: Crypto funding rates are charged on notional, not margin. A 3-day hold with a 0.5% stop loses ~18% of 1R to funding alone — before any trade result.
- Regime Change: A strategy optimized for one volatility regime doesn’t travel. The Nasdaq-Corn study’s “5-day lag, r = −0.6355” claim could not be reproduced in a 6,467-trading-day DCC-GARCH re-validation and has been corrected — it came from a 17-day sample, and the correction itself is now this series’ measured example.
- Correlation ≠ Direction: An FX reversion model reverted 98.01% of the time. The individual trade win rate was 47.47%. These two numbers measure different things.
Most guides on backtesting mistakes are lists of things to worry about. This one is different: every failure mode described here was measured in a rollbrains experiment, with real data, and the result disagreed with what a naive backtest would have shown.
The point is not to discourage backtesting. It is to be precise about which backtests you can trust and why. Each section below identifies one structural failure, describes the measurement, and links to the full experiment so you can audit the methodology yourself.
None of these required exotic data science. They required running the same strategy twice — once with the defect present, once with it corrected — and reading what changed.
Lie #1: The Win Rate That Knows the Future (Look-Ahead Bias)
A winning backtest that references data it couldn’t have had is not a winning strategy — it’s a look-ahead artifact wearing a winning mask.
The mechanism is subtle. In Pine Script, when a strategy uses a daily ATR for an intraday stop-loss, it often reads the current day’s ATR — including volatility spikes that happened after the entry. The stop-loss buffer expands to avoid a spike before the spike has occurred. In live trading, you have no such preview, so the stop fires.
rollbrains measured this directly. A dynamic trailing stop model using a channel positioning strategy on BTC 1-hour data (56,583 bars) produced an apparent 93.3% win rate when the trailing stop updated on every candle — an impossibly high number that collapsed immediately in out-of-sample testing.
The corrected version — using ATR(t-1) instead of ATR(t), with a constant lock on the stop level after entry — showed a win rate decay of 8.8% when moving from in-sample to out-of-sample (34.3% → 25.5%). That’s a real edge degradation. The 93.3% figure was a structural lie.
The Pine Script fix: In all request.security() calls, set barmerge.lookahead_off. For daily ATR references, access the prior completed bar: ta.atr(14)[1]. Lock stop and target as numeric constants at entry time, not as dynamically updated channel levels.
→ Full measurement: The Anatomy of Look-Ahead Bias
Lie #2: The Candle That Can’t Tell You Which Exit Fired First (Intrabar Ambiguity)
An OHLC candle records four prices: open, high, low, close. It does not record when the high and low were reached, or in which order.
When a candle’s high touches your take-profit and its low touches your stop-loss, both conditions were met — but the candle cannot tell you which came first. Your backtest engine fills this gap with an assumption (usually “worst case: stop first” or “best case: target first”), and that assumption is a choice, not a measurement.
rollbrains pulled 1-minute BTC data to settle this empirically. Of 1,820 trades where both the stop-loss and take-profit were touched within a single coarser candle, 910 hit the stop first and 910 hit the target first. A perfect 50:50 coin flip. The candle contained literally zero information about which exit had priority.
The practical implication: if your strategy uses tight stops that frequently end up inside single candles, your backtest’s win rate depends heavily on which assumption your engine makes — not on the strategy’s actual edge. Switching backtest platforms can change reported performance dramatically without changing the strategy at all.
The fix: Test on the timeframe you actually trade, or finer. Count how many of your trades fall into the “both exits touched in one candle” category. If it’s a significant fraction, your reported win rate is partially a function of your engine’s assumption, not the market’s answer.
→ Full measurement: Why Your Backtest Changes When You Switch Timeframes
Lie #3: The Slippage You Didn’t Model (Market Impact)
“I’ll add 0.1% slippage to be safe” is one of the most common and most dangerous sentences in backtesting. It is safe for large-cap stocks. It is not safe for altcoins, DEX pools, or thinly traded crypto perpetuals.
Order books have gaps. When you send a market order, it doesn’t fill at the best price — it sweeps through price levels until your entire order is filled. A 5,000-unit market order in an altcoin market with 2,000 units at $1.00 and 3,000 units at $1.05 gets an average fill of $1.03, for 3% slippage. Your 0.1% model missed 2.9% per trade.
rollbrains ran this comparison on MATIC/USDT 1-hour data (56,583 bars). A grid system using static 0.1% slippage showed expectancy of +0.842. The same system under dynamic power-law slippage modeling — where liquidity depth shrank 78% during volatility spikes — produced a realized average slippage of 2.45%. Win rate collapsed from 48.2% to 31.5%, a 16.7% drop. Net expectancy went to −0.182.
The adaptive version, which scaled position size down to $3,500 from $10,000 when depth fell, preserved +0.412 expectancy. The difference between “ignored slippage” and “modeled slippage” was the difference between profitable and broke.
The fix: For crypto, use a non-linear power-law slippage model: Slippage(Q) = α × (Q / Depth)^β where β converges empirically to 0.5–0.8. Scale down position size when depth falls below 10x your order size.
→ Full measurement: Order Book Microstructure and Slippage Simulation
Lie #4: The Entry That Looks Like a Parameter But Is Actually the Edge (Entry Price)
Most traders treat entry placement as a tuning step after the strategy logic is locked. That’s backwards. Entry placement decides which trades fill — and the trades that fill determine the entire edge.
rollbrains tested this on a harmonic pattern reversal strategy: same logic, same stop, same target, same data. The only change was where the entry order sat — at the projected Fibonacci pivot (tight) versus the midpoint of the reversal zone (slightly deeper).
The results across 11,149 filled patterns:
| Metric | Projected entry | Zone-center entry |
|---|---|---|
| Return per trade | +0.875R | +0.046R |
| Win rate | 73.6% | 56.1% |
| Sharpe | 0.136 | 0.065 |
A 19x gap in expected value from one entry decision. The mechanism is selection bias: a deeper entry only fills when price pushes past the normal reversal point — which is the signature of a trade that’s already failing. Clean reversals turn before reaching the deeper order and never fill it. So the deeper entry systematically collects the losing trades.
This isn’t a small sensitivity. Five patterns flipped from net profitable to net losing when the entry moved by a fraction of the pattern’s size.
The takeaway: Test entry placement first, before tuning anything else. If two reasonable entry variants produce wildly different results, that gap is information — the edge is concentrated in a narrow entry band, and that band is fragile.
→ Full measurement: The Backtest Autopsy #1 — Why Your Entry Price IS the Edge
Lie #5: The Crypto Backtest That Forgets Funding (Survivorship Bias and Data Gaps)
Crypto perpetual futures have two structural backtesting traps that don’t exist in stocks or spot markets.
Trap 1 — Funding drag on notional. Funding fees are charged on the full notional contract value, not on your margin. A tight 0.5% stop-loss implies roughly 200x notional leverage. At a baseline funding rate of 0.01% per 8-hour window, that’s 2% of 1R consumed per funding window. Over three days (nine windows): 18% of 1R, before the trade result. During strong trends, funding expands to 0.03%–0.05% per window — meaning a multi-day hold can drain 50% of 1R in funding alone. If your backtest ignores this, every long-hold edge you’ve measured may have been wiped out in live trading from the start.
Trap 2 — Silent data gaps. Crypto markets run 24/7. A single REST API loop with no integrity check silently drops candles when rate limits or connection errors hit. Missing candles shift rolling indicators (ATR, moving averages) forward in time, so a signal that fires at bar T in your backtest would, on complete data, have fired at T+k. You’re testing a different strategy than the one you deploy.
The fix for both is specific: use the corrected funding formula funding_R = sign × rate × periods / stop_fraction to deduct funding from each trade’s expectancy. And build a three-tier data collection pipeline with gap detection rather than a single API loop.
→ Full methodology: The 5 Graveyards of Crypto Backtesting
Lie #6: The Strategy That Works in One Regime and Dies in Another (Regime Change)
A backtest that spans multiple market regimes without accounting for them isn’t testing a strategy — it’s testing an average across incompatible environments.
rollbrains set out to measure this in a multi-asset hedging study: does buying corn futures actually protect a Nasdaq-heavy portfolio during equity crashes? The original post reported a 5 business-day lag with r = −0.6355. A reader-prompted DCC-GARCH re-validation (2000–2026, 6,467 trading days) could not reproduce that structure with real data: the volatility cross-correlation is flat at +0.07 to +0.09 across every lag (±10), and the original figure traces to a 17-day sample — 12.3% of all windows of that length reach the same level by pure chance.
The practical implication: a hedge that “works in backtest” may simply be a small-sample correlation. The K-Means 3-regime separation itself held statistically (p ≈ 2×10⁻²⁹), but the regime-level correlation difference was Δρ ≈ 0.02 with no sign change — economically meaningless, and no basis for timing a hedge.
The broader lesson applies to any strategy: if your backtest covers multiple volatility environments (Low-Low, High Tech, Crisis) without distinguishing between them, you’re mixing results from fundamentally different markets. A strategy that thrives in low-volatility trending markets will fail in mean-reverting or crisis regimes — and the backtest won’t tell you unless you explicitly separate them.
The fix: Use K-Means clustering or a GARCH-based regime classifier to split your historical data into regimes before evaluating strategy performance. Separately report results for each regime. Don’t trust a blended Sharpe number.
→ Full measurement (corrected): Is Buying Corn Futures Safe When Stocks Crash? → The self-audit: the 5-day negative transmission is not in the real data
Lie #7: The Signal That Reverts 98% of the Time But Still Loses Money (Correlation ≠ Direction)
A correlated pair that decouples will, almost certainly, revert. That 98% reversion rate is real. It measures whether the relationship between the two assets normalized. It tells you nothing about which direction either individual asset moved to achieve that normalization.
rollbrains built and tested an FX correlation decoupling mean-reversion strategy:
- 8 major cross-pairs (AUDJPY, EURGBP, GBPJPY, and others)
- 10-year high-fidelity H4 dataset (Jan 2015 – Mar 2025)
- 1,108 entry triggers
- Realistic ECN friction: 2.2–3.4 pips round-trip
The correlation Z-score reverted to its baseline in 98.01% of all entry events. This is the number retail traders see and use to justify the trade.
The actual trade win rate: 47.47%. Cost-adjusted expectancy: −8.60 pips per trade. The equity curve was a mathematical path to ruin.
Why? Correlation reversion can occur in three distinct ways: asset A falls, asset B rises, or both drift toward each other from different directions. Only one of these paths profits the directional trade you placed. The Z-score doesn’t tell you which path the market will take — and neither does the correlation coefficient.
This is not a rare edge case. It’s the core structure of the trade. Every correlation-based directional strategy carries this blind spot.
The takeaway: Reversion probability and trade win rate are independent statistical dimensions. Don’t conflate them. If you trade directionally based on a relational signal, measure the win rate of the directional bet explicitly — not the signal’s reversion rate.
→ Full measurement: Correlation Is Not a Direction Signal
Summary Table
| Failure Mode | Technical Root Cause | Measured Impact | rollbrains Study |
|---|---|---|---|
| Look-Ahead Bias | Future data referenced at entry time | 93.3% illusory win rate on dynamic SL; 8.8% OOS decay once corrected | Lookahead Penetration |
| Intrabar Ambiguity | OHLC discards intra-bar path order | 50:50 coin flip on 1,820 ambiguous BTC trades | Intrabar Ambiguity |
| Slippage Ignorance | Static slippage misses order book gaps | Win rate −16.7%, expectancy flipped negative | Slippage Simulation |
| Entry Price Assumption | Entry rule decides sample composition | 19x return gap (+0.875R vs +0.046R), N=11,149 | Entry Price IS the Edge |
| Survivorship Bias | Funding on notional; silent data gaps | ~18% of 1R funding drain per 3-day hold at 0.5% stop | 5 Graveyards of Crypto |
| Regime Change | Strategy performance is regime-specific | “r=−0.6355” claim refuted on re-validation — flat +0.07~+0.09 at every lag, regime Δρ≈0.02 | Self-Audit: Regime Sync Re-Validation |
| Correlation ≠ Direction | Reversion rate ≠ directional win rate | 98.01% reversion vs 47.47% win rate; −8.60 pips/trade | Correlation Not Directional |
What These Seven Have in Common
Each of these seven failures shares a structural feature: the backtest reports a number that is real but doesn’t answer the question you were asking.
- 93.3% win rate is real — it measures an artificial break-even, not the edge.
- 98% reversion is real — it measures a relational signal, not a directional trade.
- +0.875R return is real — but only for one specific entry placement.
- The stop fired at the right price — but the order of execution was assumed, not measured.
Backtesting is not the same as measuring. A backtest produces a simulation of the past under a set of assumptions. The seven failures above are seven different ways those assumptions diverge from what actually happens in live execution.
The rollbrains position: we test these assumptions explicitly, report where they fail, and publish the negative results as a public record — because knowing what doesn’t work is at least as valuable as knowing what does.
FAQ
Q1. What is the single most common backtesting mistake?
Look-ahead bias — using data that wasn’t available at the time of the trade decision. In Pine Script, this most often occurs via ATR or ATR-based trailing stops that reference the current unfinished daily bar, artificially dodging stop-outs that would only occur in live trading.
Q2. How much can slippage affect a crypto backtest?
More than most developers model. In a rollbrains altcoin grid experiment, ignoring dynamic slippage caused a 16.7% win rate collapse (from 48.2% to 31.5%) and drove net expectancy to -0.182 from +0.842. A static 0.1% slippage assumption misses gaps that realistically reach 3% or more in thin altcoin markets.
Q3. Why does switching timeframes change backtest results?
A candle is a summary, not a path. When both the stop-loss and take-profit fall inside one candle, the candle cannot reveal which was hit first. A rollbrains check on 1,820 BTC trades found the real order was a 50:50 coin flip — the candle literally contains no information about the outcome.
Q4. Can a 98% signal success rate still lose money in trading?
Yes. rollbrains documented this precisely: an FX correlation mean-reversion setup reverted its signal 98.01% of the time, yet produced only a 47.47% win rate and a -8.60 pip expectancy per trade. Signal reversion and trade direction are independent statistical dimensions.
Q5. What is look-ahead bias in Pine Script and how do I prevent it?
Look-ahead bias most often enters through request.security() calls without barmerge.lookahead_off, or through ATR calculations that reference the current incomplete daily bar. The fix is to set barmerge.lookahead_off on all request.security() calls and always reference the prior completed bar (index [1]) for daily indicators used in intraday strategies.
Related Research — The Backtest Autopsy Series
- Backtest Autopsy #1: Why Your Entry Price IS the Edge — 19x performance gap from one entry rule change
- Backtest Autopsy #2: The Anatomy of Look-Ahead Bias — how an unclosed daily ATR leaks future volatility into a “dynamic” stop, confirmed with a Pandas shift audit
- Backtest Autopsy #3: Order Book Microstructure and Slippage Simulation — why a flat slippage assumption misses power-law market impact, and how queue-probability filters model the fill you’d actually get
- Backtest Autopsy #4: Why Your Backtest Changes When You Switch Timeframes — intrabar OHLC ambiguity, 1,820 trade coin-flip check
- Backtest Autopsy #5: Is Buying Corn Futures Safe When Stocks Crash? — GARCH + K-Means regime synchronization (corrected 2026-06)
- Backtest Autopsy #6: Why the Corpse on the Table IS Our Own Post — self-audit refuting #5: across 6,467 trading days the cross-correlation is +0.07~+0.09 at every lag; the claimed 5-day structure could not be reproduced with real data
- The 5 Graveyards of Crypto Backtesting — the funding drag formula that notional-based fees demand, and why a single API loop lets data gaps pass silently
- Correlation Is Not a Direction Signal — 98.01% reversion, 47.47% win rate paradox
Academic foundation. The statistical case for treating any great-looking backtest skeptically — and for why over-searched strategies fail out-of-sample — is laid out in Bailey, Borwein, López de Prado & Zhu, The Probability of Backtest Overfitting.
Last verified: June 2026
Key figures
Frequently asked
What is the single most common backtesting mistake?
How much can slippage affect a crypto backtest?
Why does switching timeframes change backtest results?
Can a 98% signal success rate still lose money in trading?
What is look-ahead bias in Pine Script and how do I prevent it?
Educational content only — not investment or financial advice. Data, prices, and tool specifications change; verify independently and paper-trade before risking capital.