💡 TL;DR — 7 Structural Failure Modes, Each Measured (BLUF)
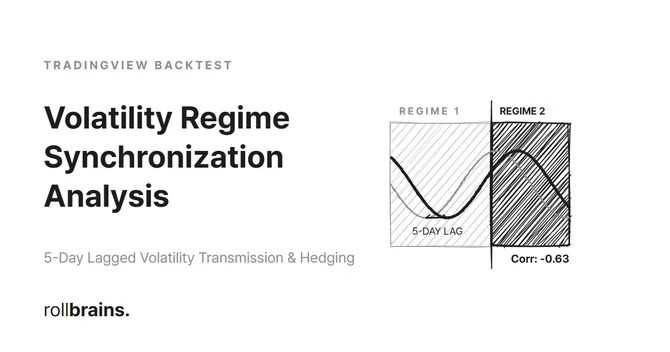
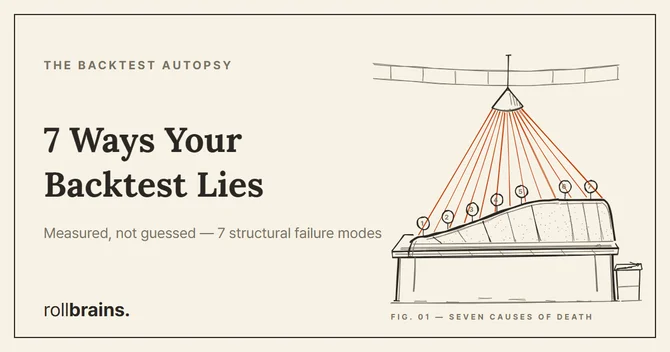
Look-Ahead Bias: A tight ATR trailing stop can produce a 93.3% win rate in backtest. That win rate is a mathematical artifact of the stop being set after the move it was supposed to protect against. Intrabar Ambiguity: When both stop-loss and take-profit fall inside one candle, the candle contains no information about which fired first. rollbrains measured this on 1,820 BTC trades: the real answer was a coin flip. Slippage: In a rollbrains altcoin grid test, ignoring dynamic slippage drove win rate from 48.2% to 31.5% — and flipped net expectancy negative. Entry Price: Two reasonable entry placements, same logic, same exits. One returned +0.875R per trade. The other returned +0.046R. A 19x gap from one decision. Survivorship Bias: Crypto funding rates are charged on notional, not margin. A 3-day hold with a 0.5% stop loses ~18% of 1R to funding alone — before any trade result. Regime Change: A strategy optimized for one volatility regime doesn’t travel. The Nasdaq-Corn study’s “5-day lag, r = −0.6355” claim could not be reproduced in a 6,467-trading-day DCC-GARCH re-validation and has been corrected — it came from a 17-day sample, and the correction itself is now this series’ measured example. Correlation ≠ Direction: An FX reversion model reverted 98.01% of the time. The individual trade win rate was 47.47%. These two numbers measure different things. Most guides on backtesting mistakes are lists of things to worry about. This one is different: every failure mode described here was measured in a rollbrains experiment, with real data, and the result disagreed with what a naive backtest would have shown.
...