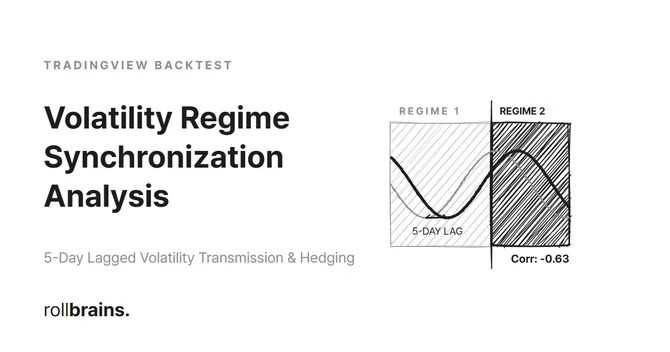
Nasdaq vs Corn Futures Volatility Regime Analysis

Is Buying Corn Futures Safe When Stocks Crash? Statistical Hedging Timing Analysis

⚠ Correction (2026-06-11): An earlier version of this post claimed a 5-business-day lagged negative volatility transmission from the Nasdaq-100 to Corn futures (r = −0.6355), supported by a GARCH(1,1) table and an N = 11,149 sample. A full re-verification could not reproduce any of it with real data: across 6,467 trading days (2000–2026) the volatility cross-correlation is flat at +0.07 to +0.09 at every lag, and the original table’s GARCH column traces to a pipeline error — a pure exponential decay, not a GARCH output. The text below reflects the corrected, measured figures. The full forensic walkthrough is in the self-audit post. ...
May 25, 2026 · 9 min · Steve
The Backtest Autopsy

The Backtest Autopsy #6: Why the Corpse on the Table IS Our Own Post

💡 TL;DR — The Self-Audit Verdict (BLUF) The headline claim does not reproduce: across 6,467 trading days (2000–2026), the NDX–ZC volatility cross-correlation is flat at +0.07 to +0.09 at every lag from −10 to +10. The original post’s 5-day-lag negative correlation (printed as −0.6355) could not be reproduced with real data. The “GARCH” column was not GARCH: the original table’s conditional-volatility columns are pure exponential decay — log-linear R² = 0.99987 (NDX) and 0.99849 (ZC) — with zero shock response. A pipeline error, now documented and corrected. The window was a lottery: 12.3% of all 17-day windows in the full sample reach a correlation ≤ −0.6355 by chance alone. A 17-day correlation carries no evidential weight. Verdict: C1 refuted, C2 partially confirmed, C3 refuted. The original post is corrected; this audit is the public record. Seventeen days ago we published a hedging study claiming that Nasdaq-100 volatility shocks transmit to corn futures with a 5-business-day lag and a correlation of −0.6355. Seventeen is a fitting number, because seventeen rows of data is exactly what that claim stood on. A reader suggested we re-check the relationship with a proper DCC-GARCH model instead of a static correlation table — so we did, against 6,467 trading days of real NDX and ZC data spanning 2000–2026. ...

June 11, 2026 · 19 min · Steve
Correlation Is Not a Direction Signal

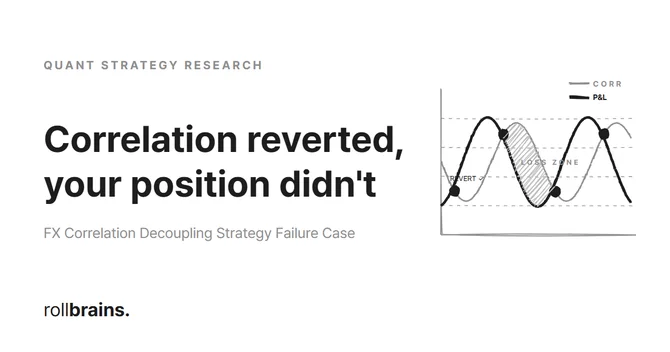
Correlation Is Not a Direction Signal: Inside a 98% Reversion, 47.47% Win-Rate Real-World Failure

💡 Key Takeaways The Reversion Fallacy: The rolling correlation Z-score successfully converged to its baseline with a stellar 98.01% probability, but the directional trades placed on the decoupled legs yielded a dismal 47.47% win rate. Lack of Directional Alpha: Correlation reversion can occur via multiple distinct price paths (Dynamic Drift). A relative spread convergence does not guarantee a specific direction for either individual asset. Trading a relational indicator as a single-instrument direction signal is statistically identical to a coin flip. Safe-Haven Turbulence: JPY cross-pairs structurally violate the mean-reversion assumption during global risk-off regimes, trending aggressively in one direction. Adding broker fee friction completely devours any remaining micro-alpha. This report is part of the COREX negative-result archive, published transparently in our Quant Strategy Research Hub. All figures presented in this article are verified empirical results obtained under the PRISM-R Framework v4.6.0 using a high-fidelity 10-year FX historical dataset, independent of any commercial software or affiliate marketing schemes. ...

May 31, 2026 · 12 min · Steve