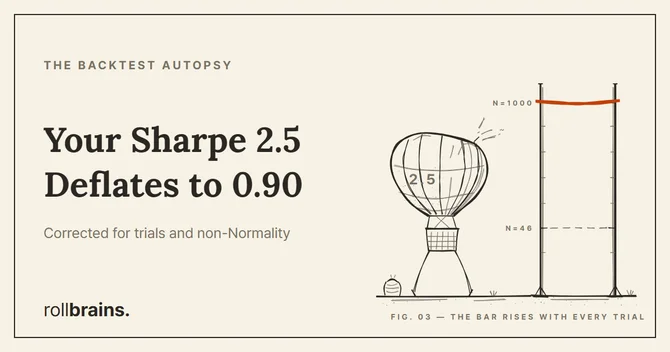
The Deflated Sharpe Ratio explained — correcting a backtest Sharpe for trials and non-Normality

The Deflated Sharpe Ratio: Why a 2.5 Sharpe Can Still Be Statistical Noise

💡 Key Takeaways A high Sharpe is not evidence on its own. The Deflated Sharpe Ratio (DSR) corrects a backtest Sharpe for two inflation sources at once: selection bias from trying many strategies, and non-Normal (skewed, fat-tailed) returns. The bar moves with the number of trials. Even if the true Sharpe is zero, the expected maximum Sharpe across N independent trials is positive. DSR sets the rejection threshold to that expected maximum — so the more you search, the higher you must clear. The worked number is sobering. A Sharpe of 2.5 (5 years daily, skew −3, kurtosis 10) found after N=1000 trials has a DSR of only ≈ 0.90 — it fails the 95% bar. The identical result found after just N=46 trials would have passed at 0.9505. This explainer reconstructs the Deflated Sharpe Ratio strictly from the primary source — Bailey & López de Prado, “The Deflated Sharpe Ratio: Correcting for Selection Bias, Backtest Overfitting and Non-Normality” (Journal of Portfolio Management, 2014). It pairs with our empirical Backtest Autopsy series, which measures the failures this metric is designed to catch. ...

June 9, 2026 · 9 min · Steve
The 5 Graveyards of Crypto Backtesting

The 5 Graveyards of Crypto Backtesting

💡 Bottom Line A crypto perpetual-futures backtest fails live for five reasons, but only two are crypto-specific: notional-based funding drag and silent data gaps. Fix those here. The other three (limit-fill illusion, slippage and latency, look-ahead bias via joins) are universal backtest sins that apply to stocks, FX, and futures alike. We measured each one with real data in the Backtest Autopsy series, so this guide links out instead of repeating them. The funding numbers below are worked calculations from stated assumptions, not a measured study. The measured forensics live in the linked spokes. This is a methodology guide, not a forensic report. Where a claim needs measured proof, we point to the specific Backtest Autopsy spoke that measured it, rather than reproducing numbers here. ...

June 4, 2026 · 10 min · Steve
Correlation Is Not a Direction Signal

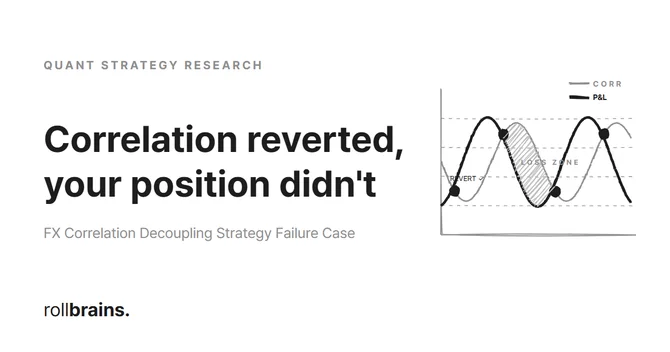
Correlation Is Not a Direction Signal: Inside a 98% Reversion, 47.47% Win-Rate Real-World Failure

💡 Key Takeaways The Reversion Fallacy: The rolling correlation Z-score successfully converged to its baseline with a stellar 98.01% probability, but the directional trades placed on the decoupled legs yielded a dismal 47.47% win rate. Lack of Directional Alpha: Correlation reversion can occur via multiple distinct price paths (Dynamic Drift). A relative spread convergence does not guarantee a specific direction for either individual asset. Trading a relational indicator as a single-instrument direction signal is statistically identical to a coin flip. Safe-Haven Turbulence: JPY cross-pairs structurally violate the mean-reversion assumption during global risk-off regimes, trending aggressively in one direction. Adding broker fee friction completely devours any remaining micro-alpha. This report is part of the COREX negative-result archive, published transparently in our Quant Strategy Research Hub. All figures presented in this article are verified empirical results obtained under the PRISM-R Framework v4.6.0 using a high-fidelity 10-year FX historical dataset, independent of any commercial software or affiliate marketing schemes. ...

May 31, 2026 · 12 min · Steve